Welcome to the TIminer documentation!
TIminer encloses a panel of computational tools for the investigation of tumor-immune cell interactions [4]:
- Gene expression: Kallisto is used to efficiently quantify gene expression levels [2].
- Immune infiltrates: the enrichment of immune subpopulations is assessed through gene set enrichment analysis (GSEA) [9] as in [1] [3].
- Tumor immunogenicity: the expression of genes related to Human Leukocite Antigens (HLA) genes, co-inhibitory or co-stimulatory signaling, and infiltration of immune cells, is used to compute an “immunophenogram” and an “immmunophenoscore” (IPS), describing the tumor antigenicity and the mechanisms of immune evasion [3].
- HLA typing: Optitype is used to predict class-I HLA types, at 4-digit resolution, from RNA or DNA sequencing data [10].
- Neoantigens: candidate neoantigens are predicted in three steps: (1) mutated proteins are inferred from somatic mutations using the Variant Effect Predictor (VEP) [6]; (2) mutated peptides 8-to-11 amino acids long are extracted and analyzed with NetMHcpan 3.0 to predict their binding affinity to class-I HLAs [5] [7] [8]; (3) neoantigens are selected considering gene expression.
Similar methods were used to generate the data of the The Cancer Immunome Database (TCIA) [3].
The pipeline is a Python script executable from the command line or through a user interface. The user interface allows the analysis of single-subject data on standard desktop PCs, whereas the command-line version allows the analysis of single- or multiple-subject data in a single run. The input files must contain RNA sequencing reads and somatic DNA mutations.
In addition to the pipeline, each analytical tool is available through a unified Python API that can be executed independently on data from single or multiple subjects. The Python API masks the complexity arising from different programming languages, handles necessary data pre- and post-processing internally, and introduces parallel execution traces to optimize for cluster units. TIminer is available as a Docker-based image (www.docker.com) and is distributed under BSD 3-Clause License. The third party tools included come with their own licensing scheme.
Indices and tables
Requirements
- HLA-typing requires the same amount of memory as the total input file size (e.g. for two paired-end FASTQ files of 6Gb each, 12Gb of free memory are required).
- All tools can leverage on multicore architectures (the more CPU cores are available, the faster the analysis).
- Data from single subjects can be analyzed on modern desktop PCs or laptops.
- 22Gb of free disk space is required to download the genome reference databases.
- The API is available for Python 2.7.
Install
Mac OS X
- Download the TIminer installer.
- Execute
install_mac.commandinside the ‘install’ directory of the tool and follow the instructions. - For maximal performance, increase dockers CPU and Memory count to the maximum (Docker->Preferences->General).
Note: TIminer requires OS X Yosemite or newer.
Red Hat derivatives
- Download the TIminer installer.
- Excute
sh install_red_hat.shinside the ‘install’ directory of the tool and follow the instructions.
Note: TIminer requires Fedora 23 / Centos 7 or newer.
Singularity
- Download the TIminer installer.
- optional but recommended:
conda create -n timiner python=2.7 - optional but recommended:
conda activate timiner mkdir timiner-singularitycd timiner-singularitytar -xzvf ../timiner_Singularity_installer.tar.gzcd installsh install_singularity.sh- optional but recommended:
python TIminerPipeline.py --input ../samples/inputInfo.txt --out ../samples/out
TIminer Pipeline
An overview of the TIminer pipeline is provided below.
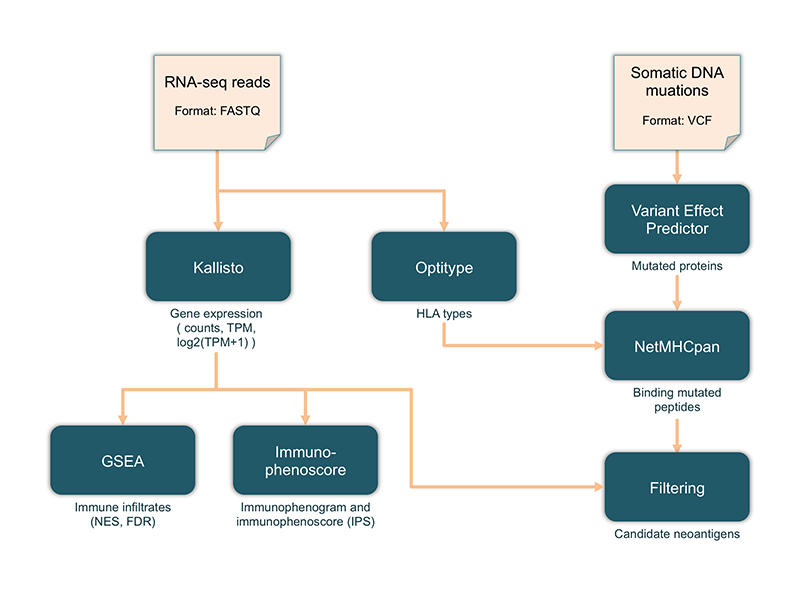
The pipeline considers two types of input data: RNA-seq data reads and DNA mutations.
RNA-seq data are used to compute gene raw counts, Transcripts Per Millions (TPM), and normalized log2(TPM+1), with Kallisto and to predict class-I HLA types with Optitype. Normalized TPM are used to estimate the enrichment of different immune subpopulations through gene set enrichment analysis, which returns the normalized enrichment scores (NES) and the associated false-discovery-rate (FDR)-corrected p-values. Normalized TPM are also used to compute the immunophenoscore (IPS) and to chart the immonophenogram. Single-point DNA mutations are used to predict mutated proteins with VEP. The mutated proteins and the predicted class-I HLA types are then subjected to NetMHCPan to predict mutated peptides binding to HLAs. These mutated peptides can be filtered considering only peptides arising from expressed genes, identified from normalized TPM, to finally select candidate neoantigens.
Input files
RNA-seq reads must be provided as FASTQ files (one file in case of single-end sequencing, two files in case of paired-end sequencing). DNA mutations can be provided in VCF format.
All RNA-seq and DNA mutations files can be processed also in gzipped format.
Running the pipeline from command line
The TIminerPipeline.py is a single Python script executing the wrapped tools over the defined API and forms a full data analysis pipeline.
usage: python TIminerPipeline.py [-h] --input INPUT --out OUT [--database DATABASE] [--threadcount THREADCOUNT] [--sensitivefiltering]
- input (str) - Path to the
input information file: a tab-delimited file specifying, for each subject: the subject ID, the cancer type, the path to the input RNA-seq files (RNAseq1.fastqandRNAseq2.fastq) and the path to the mutation files (mutation1,mutation2, etc.). In case of single-end data, the second RNA-seq file must be simply specified as “None”. One mutation file is mandatory; multiple mutation files can be specified in additional columns. - out (str) - Path to the output directory.
- threadcount (int) - Number of threads to be used (default=2).
- sensitivefiltering - acitvates the sensitive filtering option
After the installation, small example data can be analyzed by executing from the scripts directory the following command:
python TIminerPipeline.py --input ../samples/inputInfo.txt --out ../samples/out
At the end of the computation, all output files are saved in the specified output directory.
Running the pipeline from the user interface
The analysis tools for a single subject are also accessible over an easy-to-use user interface, which can be used on standard hardware desktop PCs and laptops. The user interface can be started by executing the following command from the script directory:
usage: python TIminerUI.py [--database DATABASE]
The ‘—database’ option specifies the path to the Kallisto reference index and VEP genomic annotation (default = directory defined at installation time).
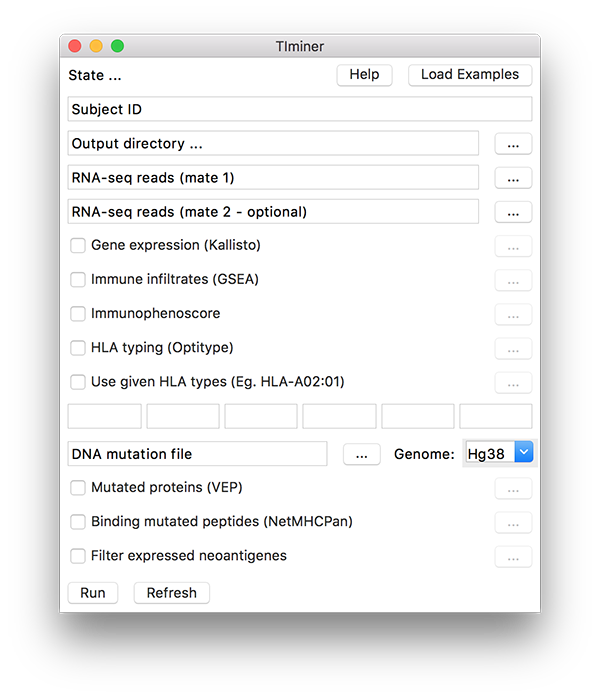
The user interface allows loading the input data, selecting the set of analyses to be performed, and specifying the output directory were the results will be saved. Alternatively, the “Load examples” button allows automatically loading mock example data and selecting all the analyses to be run.
When available, pre-computed HLA types can be specified by the user to be used for neoantigen prediction (“Use given HLA types”). Up to the six HLA types have to be specified through in the available text fields, using the following format: HLA-A01:01.
While the analysis is being performed, the current state and possible issues are reported at the top of the user interface window (“State …”). The selected analyses can be run clicking the “Run” button, the results are saved in the specified output directory, which can be opened directely from the user interface.
Output files
The pipeline generates the following sub-directories and files:
The gene-expression directory contains the output files generated by Kallisto:
expression.txt: main file of gene expression values, computed as log2(TPM+1). It is a tab-delimited file with genes in its rows and subjects in its columns; the first column contains the HGNC gene symbols.tpm_expression.txt: file of gene TPM, with the same format of expression.txt.raw_count_expression.txt: file of raw gene counts, with the same format of expression.txt.
The immunophenoscore directory contains the following files:
IPS_Sample.pdf: the plot of the immunophenogram (one for each subject).IPS.txt: tab-delimited file with subjects inside the rows and scores inside the columns. The considered scores are: z-scores for major histocompatibility complex genes (MHC), checkpoint blockers and immunomodulators (CP), effector immune cells (EC), suppressor cells (SC), aggregated z-score (AZ) and immunophenoscore (IPS).
The gene-set-enrichment-analysis directory contains:
NES: a tab-delimited file of normalized enrichment scores (NES) computed for each subject (inside the rows) and each immune cell type (inside the columns). The first column contains the subject ID.FDR_q-val.txt: a tab-delimited file of false-discovery-rate (FDR)-adjusted p-values (i.e. q-values), with the same format of the NES.txt file.- SubjectID.GseaPreranked: a subdirectory (for each subject) containing all GSEA original output files.
The hla-types directory contains:
hlas.tsv: a tab-delimited file of 4-digits HLA types, with subjects inside the rows and two alleles for each HLA gene (HLA-A, HLA-B, and HLA-C) inside the columns.
The mutated-proteins directory contains output files generated by VEP:
subjectID_mutprotein_info.txt: a tab-delimited file (one file for each subject) with the annotated somatic DNA mutations. The information inside the columns is:- Uploaded_variation: subject ID
- Location: genomic position of the mutation
- Allele: reference allele
- Gene: Ensemble gene ID
- Feature: feature ID
- Feature_type: feature type
- Consequence: mutation type
- cDNA_position: position of the mutation in the cDNA
- CDS_position: position of the mutation in the CDS
- Protein_position: position of the mutation in the protein
- Amino_acids: amino acid change
- Codons: codon change
- Existing_variation: information about existing variation
- Extra: additional annotations, among which the ID of the affected (i.e. mutated) protein.
subjectID_mutprotein_seq.txt: a FASTA file (one file for each subject) with the amino acid sequence of all mutated proteins reported in the file of annotated mutations.vep.tsv: text file reporting, for each subject, the names of the two output files generated by VEP for the mutprotein_info.txt path on the first column and the mutprotein_seq.txt path on the second column.
The binding-peptides directory contains the output files generated by NetMHCpan:
subjectID_binding_peptides.txt: a tab-delimited file for each subject containing the information about all HLA-binding peptides. The information inside the columns is:- SubjectID: subject ID
- Pos: genomic position of the mutation
- GeneID: Ensemble gene ID
- TranscriptID: Ensemble transcript ID
- GeneSymbol: Gene Symbol
- Protein: mutated protein
- ProteinPos: position of the mutated amino acid in the protein
- Mut: amino acid change
- VariantType: type of variant
- HLA: HLA type
- MutPeptide: mutated peptide
- MutAFF: affinity of the mutated peptide in nM
- MutRank: rank of the mutated peptide
- RefPeptide: unmutated peptide
- RefAFF: affinity of the unmutated peptide in nM
- RefRank: rank of the unmutated peptide
netmhcpan.tsv: text file reporting, for each subject, the name of the output file generated by NetMHCpan binding_peptides.txt.
The neoantigens directory contains the files:
subjectID_neoantigens: a file for each subject containing only the expressed neoantigens; it has the same columns as the files generated by NetMHCpan, plus an additional field reporting the normalized expression of the mutated gene: log2(TPM + 1).
Result interpretation
By running the pipeline from command line on the example files (as explained here), several output files are generated for a subject called Sample.
Excluding the files with straightforward interpretation and some intermediate files, such as the file of annotated DNA mutations, we can briefly interpret the output data giving some insights on tumor-immune cell interactions.
HLA typing
Optitype predicted heterozygous HLA alleles for the HLA-A gene (HLA-A31:01 and HLA-A26:01) and homozygous alleles for the HLA-B and HLA-C genes (HLA-B38:01 and HLA-C12:03, respectively).
GSEA
From GSEA results we can see that activated CD4+ T cells (ACT_CD4) are significantly enriched at a false-discovery reate of 5% (NES=2.99, q-val=0.00<0,.05). Contrariwise, the enrichment of effector memory CD8+ T cells (TEM_CD8) is not significant (NES=1.35, q-val=0.19>0.05). Activated B cells (ACT_B_CELL) are instead depleted, as their NES score is negative (NES=-2.32, q-val=0.01).
Immunophenoscore
From the immunophenoscore plot we can see that HLA-related genes are strongly up-regulated (top-left outersection, in dark red), while genes related to both effector immune cells (EC, top-right) and suppressor immune cells (SC, bottom-right) are slightly up-regulated. Most of the checkpoints molecules (CP) with immunoinhibitory effects (identified by the “-“ sign) are down-regulated, while co-stimulators (“+” sign) are both up- (CD27) and down-regulated (ICOS). Taken all together, these positive and negative contributions can be summarized in an immunophenoscore of 10 (on a [0-10] scale), representing a good immunophenotype, i.e. a tumor which is likely to elicit an effective immune response.
Neoantigens
The expressed neoantigens consist of seven mutated peptides arising from two genes: NCOA6, and TP53. The original pool of mutated peptides comprised eight peptides from three genes, but one of them was not expressed (TP53TG3D). Among the expressed neoantigens, the MNRRPILTI peptide, arising from an R>G missense mutation in TP53, was predicted to bind to HLA-C12:03 with high affinity (407.5 nM), whereas a lower affinity was predicted for its wild-type version MNRGPILTI (1059.7 nM).
TIminer API
Single-Subject data analysis
-
TIminer.TIminerAPI.executeKallisto(inputFile1, inputFile2=None, outputFile=None, index=None, subjectId='unknown', threadCount=2)¶ This function takes as input RNA-seq FASTQ files and executes Kallisto to quantify raw gene counts, Transcripts Per Millions (TPM), and normalized gene expression values computed as log2(TPM+1). More information about the output files can be found here.
Parameters: - inputFile1 (str) – Path to the first
FASTQ filecontaining the RNA-seq reads. - inputFile2 (str) – For paired-end data, path to the second
FASTQ fileof RNA-seq reads (optional). - outputFile (str) – Path to the
output fileof normalized (log2(TPM + 1)) gene expression values (optional, default = gene-expression/expression.txt). - index (str) – Path to reference index file (optional, default = path to installed database dir).
- subjectId (str) – Subject ID to be stored in the result file (optional, default = unknown).
- threadCount (int) – Number of threads to be used (optional, default = 2).
- inputFile1 (str) – Path to the first
-
TIminer.TIminerAPI.executeIPS(inputFile, outputDir=None, therapyTarget='unknown')¶ This function takes as input the file of normalized gene expression levels, computed as log2(TPM+1), and calculates the imunophenoscore (IPS) and imunophenogram.
Parameters: - inputFile (str) – Path to a
gene expression file: a tab-separated file containing the list of HGNC gene symbols inside the first column and their gene expression calculated for each subject, as log2(TPM+1), inside the following columns. The output file of Kallistoexpression.txtcan be used directly as input file (see the format in the output files section). - outputDir (str) – Path to the output directory (optional, default = immunophenoscore/).
- therapyTarget (str) – Allows to get a therapy specific imunophenoscore. Therapy targes are ‘ctla4’,’pd1’,’pd-l1’,’pd-l2’,’unknown’ or any combination provied in list format (optional, default = ‘unknown’).
- inputFile (str) – Path to a
-
TIminer.TIminerAPI.executeGSEA(inputFile, outputDir=None, scoringScheme='classic', geneSet='Charoentong_2016', maxthreads=2)¶ This function takes as an input the file of normalized gene expression levels, computed as log2(TPM+1), and calculates normalized enrichment scores (NES) and the false-discovery-rate (FDR)-corrected p-values, for 28 immune cell types, using the gene set enrichment analysis (GSEA). The original GSEA output files are also saved in the output directory.
Parameters: - inputFile (str) – Path to the
gene expression file: a tab-separated file containing the list of HGNC gene symbols inside the first column and their gene expression calculated for each subject, as log2(TPM+1), inside the following columns. The output file of Kallistoexpression.txtcan be used directly as input file (see the format in the output files section). - outputDir (str) – Path to the output directory (optional, default = gene-set-enrichment-analysis/).
- scoringScheme (str) – the scoring scheme used for the execution of the GSEA (optional, default = classic).
- geneSet (str) – allows to select between two different metagene databases ‘Aran_2017’, ‘Charoentong_2016’ or ‘Angelova_2015’ (optional, default = ‘Charoentong_2016’). Additionally, the geneSet parameter can also be set to a custom
molecular signature database file). - threadCount (int) – Number of threads to be used (optional, default = 2).
- inputFile (str) – Path to the
-
TIminer.TIminerAPI.executeOptitype(inputtype, inputFile1, inputFile2=None, outputFile=None, subjectId='unknown', threadCount=2)¶ This function takes as input FASTQ files of sequencing reads and predicts class-I HLA types for HLA-A, HLA-B, and HLA-C genes using Optitype.
Parameters: - inputtype (str) – ‘rna’ for RNA sequencing data or ‘dna’ DNA sequencing data.
- inputFile1 (str) – Path to the first
FASTQ filecontaining the reads. - inputFile2 (str) – For paired-end data, path to the second
FASTQ fileof reads (optional). - outputFile (str) – Path to the
output filecontaining the subject ID and the identified HLAs in tap-separated columns (optional, default = HLA-types/). - subjectId (str) – Subject ID to be stored in the result file (optional, default = unknown).
- threadCount (int) – Number of threads to be used (optional, default = 2).
-
TIminer.TIminerAPI.executeVep(inputFile, subject, outputFile=None, mutatedSeqOutputFile=None, cacheDir=None, genomeVersion=38)¶ This function takes as an input a file of DNA somatic mutations for each subject and predicts their impact on proteins using the Variant Effect Predictor (VEP). For each subject, it produces a file of annotated mutations and a FASTA file with the sequences of the corresponding mutated proteins. It considers only non-synonymous, Single-Nucleotide Polymorphisms (SNP).
Parameters: - inputFile (str) –
Path to the input file of somatic DNA mutations. The supported format is the VCF format.
- subject (str) – The subject ID that will appear in the output file.
- outputFile (str) – Path to the
output fileof annotated DNA mutations (optional, default = mutated-proteins/subjectid_mutprotein_info.txt). - mutatedSeqOutputFile (str) – Path to the
FASTA output filewith the sequences of the mutated proteins (optional, default = mutated-proteins/subjectid_mutprotein_seq.txt). - cacheDir (str) – Path to the genomic annotation to be used by VEP (optional, default = path to installed database dir).
- genomeVersion (int) – Version of the human genome used as reference annotation, being 37 for Hg37, or 38 for Hg38 (optional, default = 38).
- inputFile (str) –
-
TIminer.TIminerAPI.executeNetmhcpan(inputFile, mutatedProteinsInputFile, hlaInputFile, outputFile, threadCount=1, minPeptideLength=8, maxPeptideLength=11, affinityThresh=500, rankThresh=None)¶ This function considers, a file of annotated mutations, a corresponding FASTA file with the sequence of the mutated proteins, and a list of class-I HLA types. It extracts short mutated peptides (default: 8-11 amino acids) and predicts their binding affinity to HLA types using NetMHcpan. Only mutated peptides with a binding affinity < 500 nM are reported in the output file.
Parameters: - inputFile (str) –
Path to the
input fileof annotated DNA somatic mutations generated by the Variant Effect Predictor (see the output files section for details). - mutatedProteinsInputFile (str) –
Path to the
FASTA filewith the sequences of the mutated proteins generated by the Variant Effect Predictor (see the output files section for details). - hlaInputFile (str) –
Path to the
filecontaining the HLA types, that can be generated with Optitype or provided by the user (for details see the output files section). - outputFile (str) – The path to the column based
output file(see the output files section for details). - threadCount (int) – Number of threads to be used (optional, default = 2).
- minPeptideLength (int) – Minimal peptide length to test (optional, default = 8).
- maxPeptideLength (int) – Maximal peptide length to test (optional, default = 11).
- affinityThresh (int) – binding affinity threshold (optional, default = 500. If set the rank threshold needs to be None).
- rankThresh (int) – ranking based binding threshold (optional, default = None. If set the binding affinity threshold needs to be None).
- inputFile (str) –
-
TIminer.TIminerAPI.filterNeoantigenFile(neoantigenInputFile, geneExpressionInputFile, filteredNeoantigenOutputFile=None, expressionThreshold=2)¶ This function considers a file of candidate neoantigens and a file of normalized gene expression levels, computed as log2(TPM+1), to select neoantigens arising from expressed genes.
Parameters: - neoantigenInputFile (str) – Path to the
neoantigen input fileas generated by the Netmhcpan, containing binding peptides as possible neoantigen canditates (see the output files section for details). - geneExpressionInputFile (str) – Path to the
gene expression file: a tab-separated file containing the list of HGNC gene symbols inside the first column and their gene expression, as log2(TPM+1), inside the second column. The output file of Kallisto expression.txt can be used directly as input file (see the format in the output files section). - filteredNeoantigenOutputFile (str) – Path to the
output file(optional, default = inputfilename_neoantigens.txt). - expressionThreshold (int) – The expression threshold in TPM. Neoantigens arising from genes with an expression lower than the threshold are discarded (optional, default = 2).
- neoantigenInputFile (str) – Path to the
-
TIminer.TIminerAPI.convertExpressionFile(inputFile, outputFile)¶ This function converts FPKM or RPKM based expression files to log2(TPM+1) expression files, that can be used as an input for the gene set enrichtment analysis, the imunophenoscore callucation or the filtering of neoantigens. RPKM (or FPKM) values for gene i, in each library, are converted with the following formula: log2(TPM_i+1) = log2[(RPKM_i)/sum(RPKM_i)*1e6+1].
Parameters: - inputFile (str) – Path to the
expression filein FPKM or RPKM format. - outputFile (str) – Path to the
resulting filein log2(TPM + 1) format.
- inputFile (str) – Path to the
Multiple-Subject data analysis
-
TIminer.TIminerAPI.executeKallistoDir(inputInfoFile, outputFile=None, index=None, threadCount=2)¶ This function takes as input RNA-seq FASTQ files and executes Kallisto to quantify raw gene counts, Transcripts Per Millions (TPM), and normalized gene expression values computed as log2(TPM+1). More information about the output files can be found here.
Parameters: - inputInfoFile (str) – Path to the
input info file. A tab-separated file specifying, for each subject: the subject ID, the path to the first RNA-seq file (RNAseq1.fastq), the path to the second RNA-seq file (RNAseq2.fastq, only for paired-end data). In case of single-end data, the third column must contain the string None. RNA-seq files must be in FASTQ format. - outputFile (str) – Path to the
output file(optional, default = gene-expression/expression.txt). - index (str) – Path to reference index file (optional, default = path to installed database dir).
- threadCount (int) – Number of threads to be used (optional, default = 2).
- inputInfoFile (str) – Path to the
-
TIminer.TIminerAPI.executeIPS(inputFile, outputDir=None, therapyTarget='unknown') This function takes as input the file of normalized gene expression levels, computed as log2(TPM+1), and calculates the imunophenoscore (IPS) and imunophenogram.
Parameters: - inputFile (str) – Path to a
gene expression file: a tab-separated file containing the list of HGNC gene symbols inside the first column and their gene expression calculated for each subject, as log2(TPM+1), inside the following columns. The output file of Kallistoexpression.txtcan be used directly as input file (see the format in the output files section). - outputDir (str) – Path to the output directory (optional, default = immunophenoscore/).
- therapyTarget (str) – Allows to get a therapy specific imunophenoscore. Therapy targes are ‘ctla4’,’pd1’,’pd-l1’,’pd-l2’,’unknown’ or any combination provied in list format (optional, default = ‘unknown’).
- inputFile (str) – Path to a
-
TIminer.TIminerAPI.executeGSEA(inputFile, outputDir=None, scoringScheme='classic', geneSet='Charoentong_2016', maxthreads=2) This function takes as an input the file of normalized gene expression levels, computed as log2(TPM+1), and calculates normalized enrichment scores (NES) and the false-discovery-rate (FDR)-corrected p-values, for 28 immune cell types, using the gene set enrichment analysis (GSEA). The original GSEA output files are also saved in the output directory.
Parameters: - inputFile (str) – Path to the
gene expression file: a tab-separated file containing the list of HGNC gene symbols inside the first column and their gene expression calculated for each subject, as log2(TPM+1), inside the following columns. The output file of Kallistoexpression.txtcan be used directly as input file (see the format in the output files section). - outputDir (str) – Path to the output directory (optional, default = gene-set-enrichment-analysis/).
- scoringScheme (str) – the scoring scheme used for the execution of the GSEA (optional, default = classic).
- geneSet (str) – allows to select between two different metagene databases ‘Aran_2017’, ‘Charoentong_2016’ or ‘Angelova_2015’ (optional, default = ‘Charoentong_2016’). Additionally, the geneSet parameter can also be set to a custom
molecular signature database file). - threadCount (int) – Number of threads to be used (optional, default = 2).
- inputFile (str) – Path to the
-
TIminer.TIminerAPI.executeOptitypeDir(inputtype, inputInfoFile, outputFile=None, threadCount=2)¶ This function takes as input FASTQ files of sequencing reads and predicts class-I HLA types for HLA-A, HLA-B, and HLA-C genes using Optitype.
Parameters: - inputtype (str) – ‘rna’ for RNA sequencing data or ‘dna’ DNA sequencing data.
- inputInfoFile (str) – Path to the
input info file. A tab-separated file specifying, for each subject: the subject ID, the path to the first read file (RNAseq1.fastq), the path to the second RNA-seq file (RNAseq2.fastq, only for paired-end data). In case of single-end data, the third column must contain the string None. - outputFile (str) – Path to the
output file(optional, default = HLA-types/). - threadCount (int) – Number of threads to be used (optional, default = 2).
-
TIminer.TIminerAPI.executeVepDir(inputInfoFile, outputDir=None, outputSummaryFile=None, cacheDir=None, genomeVersion=38, threadCount=2)¶ This function takes as input a file of DNA somatic mutations for each subject and predicts their impact on proteins using the Variant Effect Predictor (VEP). For each subject, it produces a file of annotated mutations and a FASTA file with the sequences of the corresponding mutated proteins. It considers only non-synonymous, Single-Nucleotide Polymorphisms (SNP).
Parameters: - inputInfoFile (str) –
Path to the
input info file: a tab-delimited file containing, for each subject: the subject ID (inside the first column) and the path of one or more files of somatic DNA mutations (one path per column). Supported formats for the mutation files are: the default five-column VEP format or the VCF format. - outputDir (str) – Path to the output directory (optional, default = mutated-proteins/).
- outputSummaryFile (str) – Path to the
output summary filethat will contain the list of file pairs generated by VEP for each subject (and that can be used as input info file for NetMHCpan). If not specified, the output summary file is not generated. - cacheDir (str) – Path to the genomic annotation to be used by VEP (optional, default = path to installed database dir).
- genomeVersion (int) – Version of the human genome used as reference annotation, being 37 for Hg37, or 38 for Hg38 (optional, default = 38)..
- threadCount (int) – Number of threads to be used (optional, default = 2).
- inputInfoFile (str) –
-
TIminer.TIminerAPI.executeNetmhcpanDir(hlaInputFile, inputInfoFile, outputDir=None, outputSummaryFile=None, threadCount=1, minPeptideLength=8, maxPeptideLength=11, affinityThresh=500, rankThresh=None)¶ This function considers, for each subject, a file of annotated mutations, a corresponding FASTA file with the sequence of the mutated proteins, and a list of class-I HLA types. It extracts short mutated peptides (default: 8-11 amino acids) and predicts their binding affinity to HLA types using NetMHcpan. For each subject, the results are stored as a text file that reports only the mutated peptides with a binding affinity < 500 nM.
Parameters: - hlaInputFile (str) –
Path to the
filecontaining the HLA types, with subjects inside the rows and HLA types inside the columns, that can be generated with Optitype or be provided by the user. The first column must contain the subject IDs and the subsequent columns the HLA types. - inputInfoFile (str) – Path to the
input info file: a tab-delimited file with two columns, specifying the paths of the output files generated by VEP for each subject (see the format of vep.tsv in the output files section). - outputDir (str) – Path to the output direcotry. (optional, default = binding_peptides; see the output files section for details).
- outputSummaryFile (str) – Path to the
output summaryfile that will contain the list of files generated by Netmhcpan for each subject. If not specified, the output summary file is not generated. - threadCount (int) – Number of threads to be used (optional, default = 2).
- minPeptideLength (int) – Minimal peptide length to test (optional, default = 8).
- maxPeptideLength (int) – Maximal peptide length to test (optional, default = 11).
- affinityThresh (int) – binding affinity threshold (optional, default = 500. If set the rank threshold needs to be None).
- rankThresh (int) – ranking based binding threshold (optional, default = None. If set the binding affinity threshold needs to be None).
- hlaInputFile (str) –
-
TIminer.TIminerAPI.filterNeoantigenDir(inputInfoFile, geneExpressionInputFile, filteredNeoantigenOutputDir=None, subjectCancertypeMappingInputFile=None, expressionThreshold=2)¶ This function considers a file of candidate neoantigens for each subject, and a file of normalized gene expression levels, computed as log2(TPM+1), to select neoantigens arising from expressed genes.
Parameters: - inputInfoFile (str) – Path to the
input info file: a tab-delimited file with two columns, specifying the path of the output file generated by Netmhcpan for each subject (see the format of netmhcpan.tsv in the output files section). - geneExpressionInputFile (str) – Path to the
gene expression file: a tab-separated file containing the list of HGNC gene symbols inside the first column and their gene expression calculated for each subject, as log2(TPM+1), inside the following columns. The output file of Kallisto can be used directly as an input file (see the format in the output files section). - filteredNeoantigenOutputDir (str) – Path to the output directory where the output files will be saved (optional). By default, the output is stored in the input directory.
- subjectCancertypeMappingInputFile (int) – Path to a tab-separated
file(optional) specifying the cancer type of each subject, with the subject ID in the first column and the cancer type in the second column. By default, neoantigens are filtered considering subject-specific gene expression. If the cancer mapping file is given, the median gene expression across all subjects with the same cancer type is considered. - expressionThreshold (int) – The expression threshold in TPM. Neoantigens arising from genes with an expression lower than the threshold are discarded (optional, default = 2).
- inputInfoFile (str) – Path to the
Example
The TIminer API is available as a Python module installed during the installation process. The TIminer Pipeline script is a good guideline on how to use the API. Additionally, a simple example generating the IPS for a single subject is shown here:
1 2 3 4 5 6 7 | from TIminer import TIminerAPI
geneExpression = "expression.txt"
TIminerAPI.executeKallisto(inputFile1 ="path_to_fastq1.fastq", inputFile2 ="path_to_fastq2.fastq", index = "path_to_kallisto.idx", outputFile = geneExpression, subjectId = "sample")
ips = "ips_out/"
TIminerAPI.executeIPS(inputFile = geneExpression, outputDir = ips)
|
Licensing
Kallisto: http://pachterlab.github.io/kallisto/. Kallisto is distributed under a non-commercial license with permission to use, copy, modify, and distribute the software and its documentation for educational and research not-for-profit purposes
Gene Set Enrichment Analysis: http://software.broadinstitute.org/gsea/index.jsp. The GSEA license allows free access to individuals in both academia and industry for internal research purposes. However, it is requested that every unique user registers at the GSEA website.
Optitype: https://github.com/FRED-2/OptiType. OptiType is released under a three-clause BSD license.
Variant Effect Predictor: http://www.ensembl.org/info/docs/tools/vep/index.html. VEP is released under the Apache 2.0 license.
NetMHCPan: http://www.cbs.dtu.dk/services/NetMHCpan/. NetMHCPan is released under an Academic Software License Agreement and is free for non-profit educational, academic and/or research purpose.
Immunophenoscore: https://github.com/MayerC-imed/Immunophenogram. The Immunophenoscore script is released under a BSD license.
Extended filtering: https://software.broadinstitute.org/gatk/download/auth?package=GATK. GATK tools are release under an ACADEMIC NON-COMMERCIAL RESEARCH license. Picard https://github.com/broadinstitute/picard/blob/master/LICENSE.txt is under MIT License. Hisat2 https://ccb.jhu.edu/software/hisat2/index.shtml is under GNU License.
References
| [1] | Angelova, Mihaela, et al. “Characterization of the immunophenotypes and antigenomes of colorectal cancers reveals distinct tumor escape mechanisms and novel targets for immunotherapy.” Genome biology 16.1 (2015): 1. |
| [2] | Bray, Nicolas L., et al. “Near-optimal probabilistic RNA-seq quantification.” Nature biotechnology 34.5 (2016): 525-527. |
| [3] | (1, 2, 3) Charoentong, P., Finotello, F., Angelova, M., Mayer, C., Efremova, M., Rieder, D., Hackl, H. and Trajanoski, Z. (2017) Pan-cancer immunogenomic analyses reveals genotype-immunophenotype relationships and predictors of response to checkpoint blockade. Cell Rep, 18, 1-15. |
| [4] | Hackl, Hubert, et al. “Computational genomics tools for dissecting tumour-immune cell interactions.” Nature Reviews Genetics 17.8 (2016): 441-458. |
| [5] | Hoof, Ilka, et al. “NetMHCpan, a method for MHC class I binding prediction beyond humans.” Immunogenetics 61.1 (2009): 1-13. |
| [6] | McLaren, William, et al. “The Ensembl Variant Effect Predictor.” Genome Biology Jun 6;17(1):122. (2016). |
| [7] | Nielsen, Morten, et al. “NetMHCpan, a method for quantitative predictions of peptide binding to any HLA-A and-B locus protein of known sequence.” PloS one 2.8 (2007): e796. |
| [8] | Nielsen, Morten, and Massimo Andreatta. “NetMHCpan-3.0; improved prediction of binding to MHC class I molecules integrating information from multiple receptor and peptide length datasets.” Genome medicine 8.1 (2016): 1. |
| [9] | Subramanian, Aravind, et al. “Gene set enrichment analysis: a knowledge-based approach for interpreting genome-wide expression profiles.” Proceedings of the National Academy of Sciences 102.43 (2005): 15545-15550. |
| [10] | Szolek, A., Schubert, B., Mohr, C., Sturm, M., Feldhahn, M. and Kohlbacher, O. (2014) OptiType: precision HLA typing from next-generation sequencing data. Bioinformatics, 30, 3310-3316. |